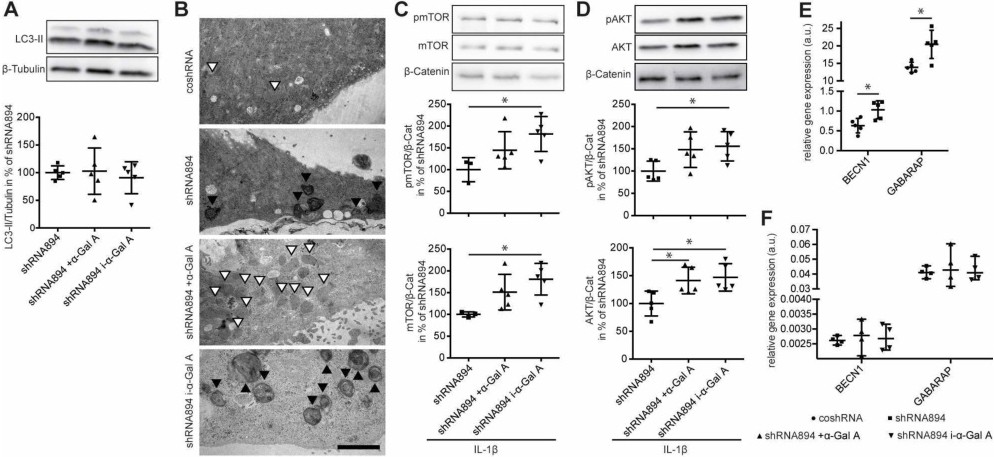
Fig. 2. Markers of autophagy in α-Gal A-deficient podocytes at baseline and under ERT. (A) Representative LC3-II and β-tubulin immunoblot and densitometric quantification of LC3-II/ß-tubulin immunoblot. Band intensity of LC3-II was normalized to β-tubulin band intensity (mean ± SD, n=5, 1 Way ANOVA, p=0,8128). (B) Representative electron microscopy of control (coshRNA) and α-Gal A-deficient podocytes (shRNA894) as well α-Gal A-deficient podocytes treated with active (+α-Gal A) or inactivated (i-α-Gal A) enzyme with marked autophagosomal / lysosomal structures (white arrowheads: autophagosomes, black arrowheads: zebrabodies, n=4) (C) Representative phospho-mTOR, mTOR and β-Catenin immunoblot and densitometric quantification of immunoblots. Band intensity of phospho-mTOR/mTOR was normalized to β-Catenin band intensity (mean ± SD, n=3 (shRNA894), n=5 (+α-Gal A, i-α-Gal A), 1 Way ANOVA, * = p<0,05. (D) Representative phospho-AKT, AKT and β-Catenin immunoblot and densitometric quantification of immunoblots. Band intensity of phospho-AKT/AKT was normalized to β-Catenin band intensity (mean ± SD, n=3 (shRNA894), n=5 (+α-Gal A, i-α-Gal A), 1-Way ANOVA, * = p<0,05). (E) RT-qPCR of BECN1, GABARAP expression, normalized against ACTB expression in control (coshRNA) and α-Gal A-deficient podocytes (shRNA894) (mean ± SD, n=5, Students T-Test, * = p<0,05). (F) RT-qPCR of BECN1, GABARAP expression, normalized against ACTB expression in α-Gal A-deficient podocytes (shRNA894) and α-Gal A-deficient podocytes treated with active (+α-Gal A) or inactivated (i-α-Gal A) enzyme (mean ± SD, n=5, 2-Way ANOVA).